Streamlit
The fastest way to build data apps in Python

Streamlit
The fastest way to build data apps in Python
- github repository: https://github.com/streamlit/streamlit
- tutorial: https://docs.streamlit.io/en/stable/getting_started.html
streamlit는 파이썬 기반으로 손쉽게 웹 어플리케이션을 개발하는 오픈소스입니다. 웹에 대한 이해 없이도 간단한 파이썬 코드만으로 대부분의 웹 어플리케이션 구현이 가능합니다. 간단한 데이터 Visualization 혹은 인공지능 모델 시연 등 여러 분야에 활용될 수 있을 것 같습니다.
Installation
- Install command
$ pip install streamlit
$ streamlit hello
👋 Welcome to Streamlit!
If you're one of our development partners or you're interested in getting
personal technical support or Streamlit updates, please enter your email
address below. Otherwise, you may leave the field blank.
Email: sh951011@gmail.com
Privacy Policy:
As an open source project, we collect usage statistics. We cannot see and do
not store information contained in Streamlit apps. You can find out more by
reading our privacy policy at: https://streamlit.io/privacy-policy
If you'd like to opt out of usage statistics, add the following to
~/.streamlit/config.toml, creating that file if necessary:
[browser]
gatherUsageStats = false
Welcome to Streamlit. Check out our demo in your browser.
Local URL: http://localhost:8501
Network URL: http://192.168.35.186:8501
Ready to create your own Python apps super quickly?
Head over to https://docs.streamlit.io
May you create awesome apps!Get Started
Create your first Streamlit app
first_app.py를 만들고 streamlit를 import 합니다.
import streamlit as st
import pandas as pdpandas는 데이터프레임을 다루는 예시를 보여주기 위해 import 합니다.
st.write()을 사용합니다.
st.title('My first app')
st.write("Here's our first attempt at using data to create a table:")
st.write(pd.DataFrame({
    'first column': [1, 2, 3, 4],
    'second column': [10, 20, 30, 40]
}))st.write()는 str 타입뿐만 아니라 pandas의 DataFrame도 손쉽게 write 할 수 있습니다.
- Run by streamlit
$ streamlit run first_app.py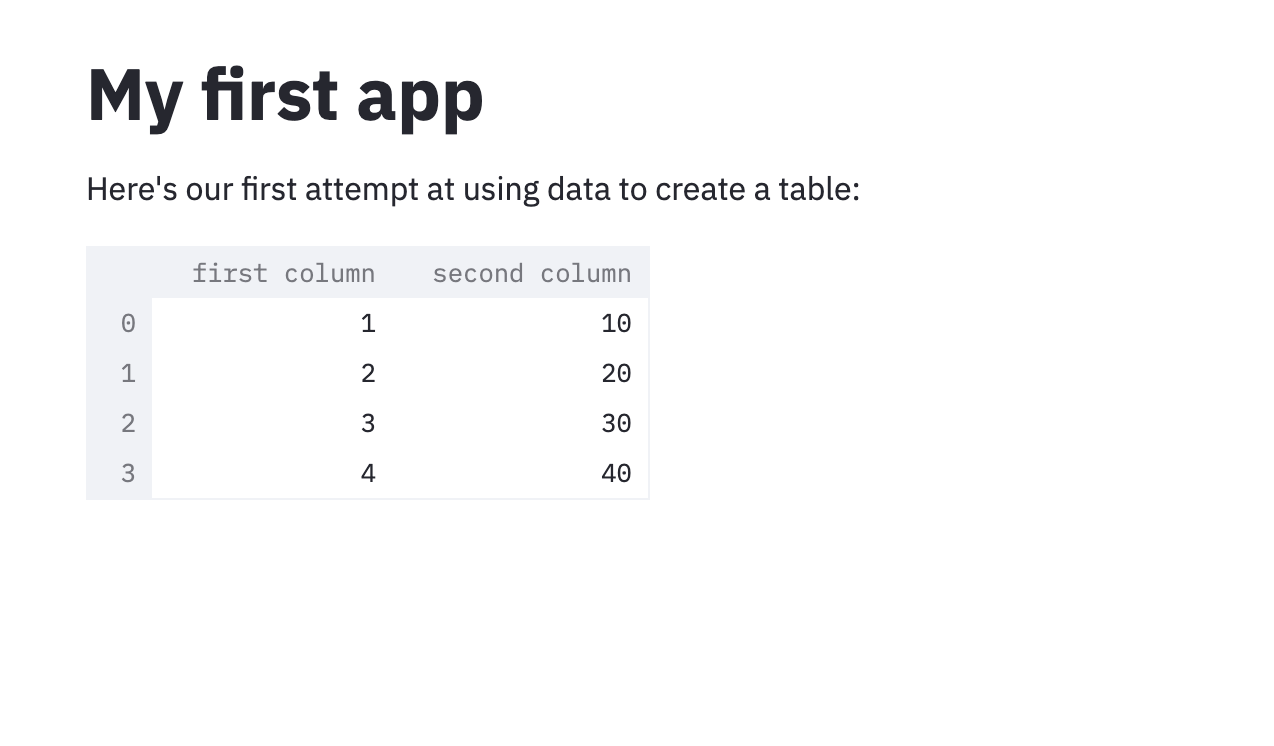
여기까지만 해도 streamlit을 활용하면 상당히 편리하게 데이터를 보여줄 수 있습니다. 다음으로는 streamlit을 이용해서 데이터 visualization하는 방법에 대해 살펴보겠습니다.
Draw charts and maps
웹 어플리케이션에 bar chart, line chart, map을 추가하는 법을 대해 배워봅시다.
- Draw a line chart
파이썬에서는 matplotlib과 같은 라이브러리를 이용하면 쉽게 line chart를 그릴 수 있습니다만, 웹 어플리케이션에서 이런 이미지를 띄우려면 상황에 따라 복잡해질 수도 있습니다. 하지만 streamlit에서는 st.line_chart() 메서드로 편리하게 line chart를 추가할 수 있습니다.
chart_data = pd.DataFrame(
     np.random.randn(20, 3),
     columns=['a', 'b', 'c'])

st.line_chart(chart_data)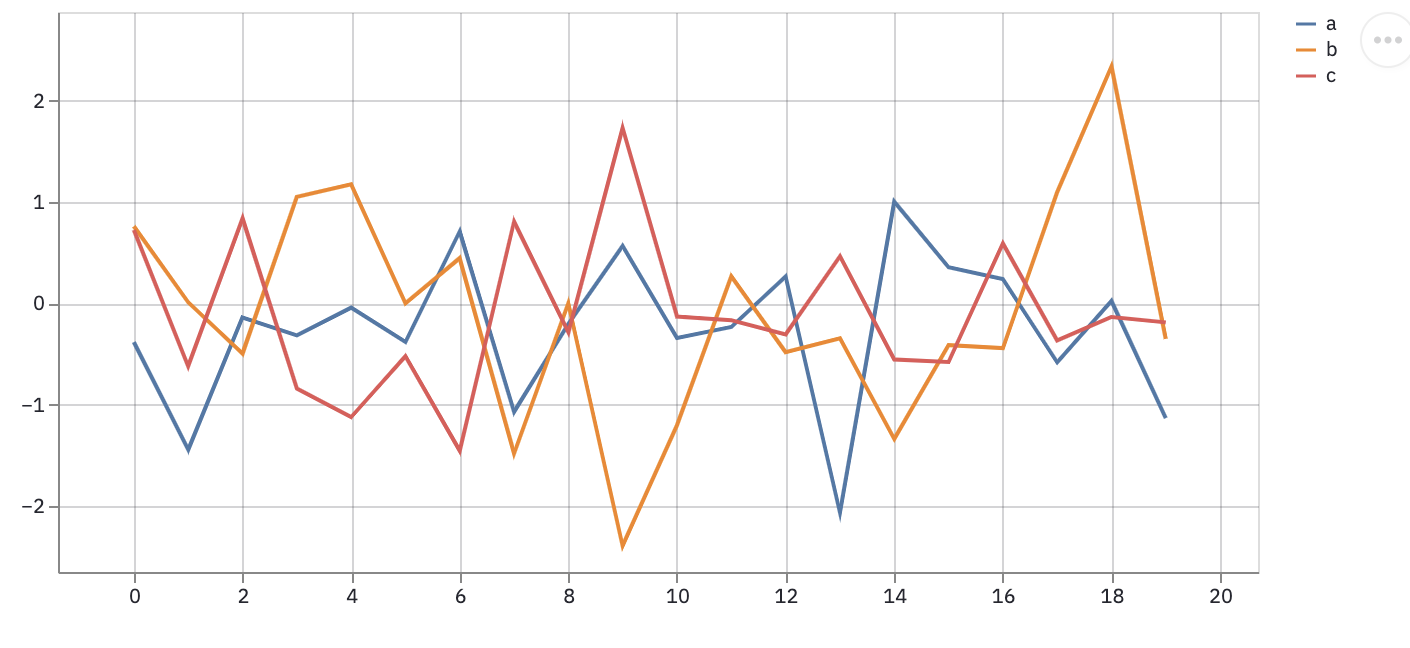
- Plot a map
지도 역시 마찬가지입니다. 노 베이스로 지도를 그린다면 굉장히 어려운 프로젝트입니다만, streamlit에서는 지도 역시 st.map() 메서드로 편리하게 지원합니다.
map_data = pd.DataFrame(
    np.random.randn(1000, 2) / [50, 50] + [37.76, -122.4],
    columns=['lat', 'lon'])

st.map(map_data)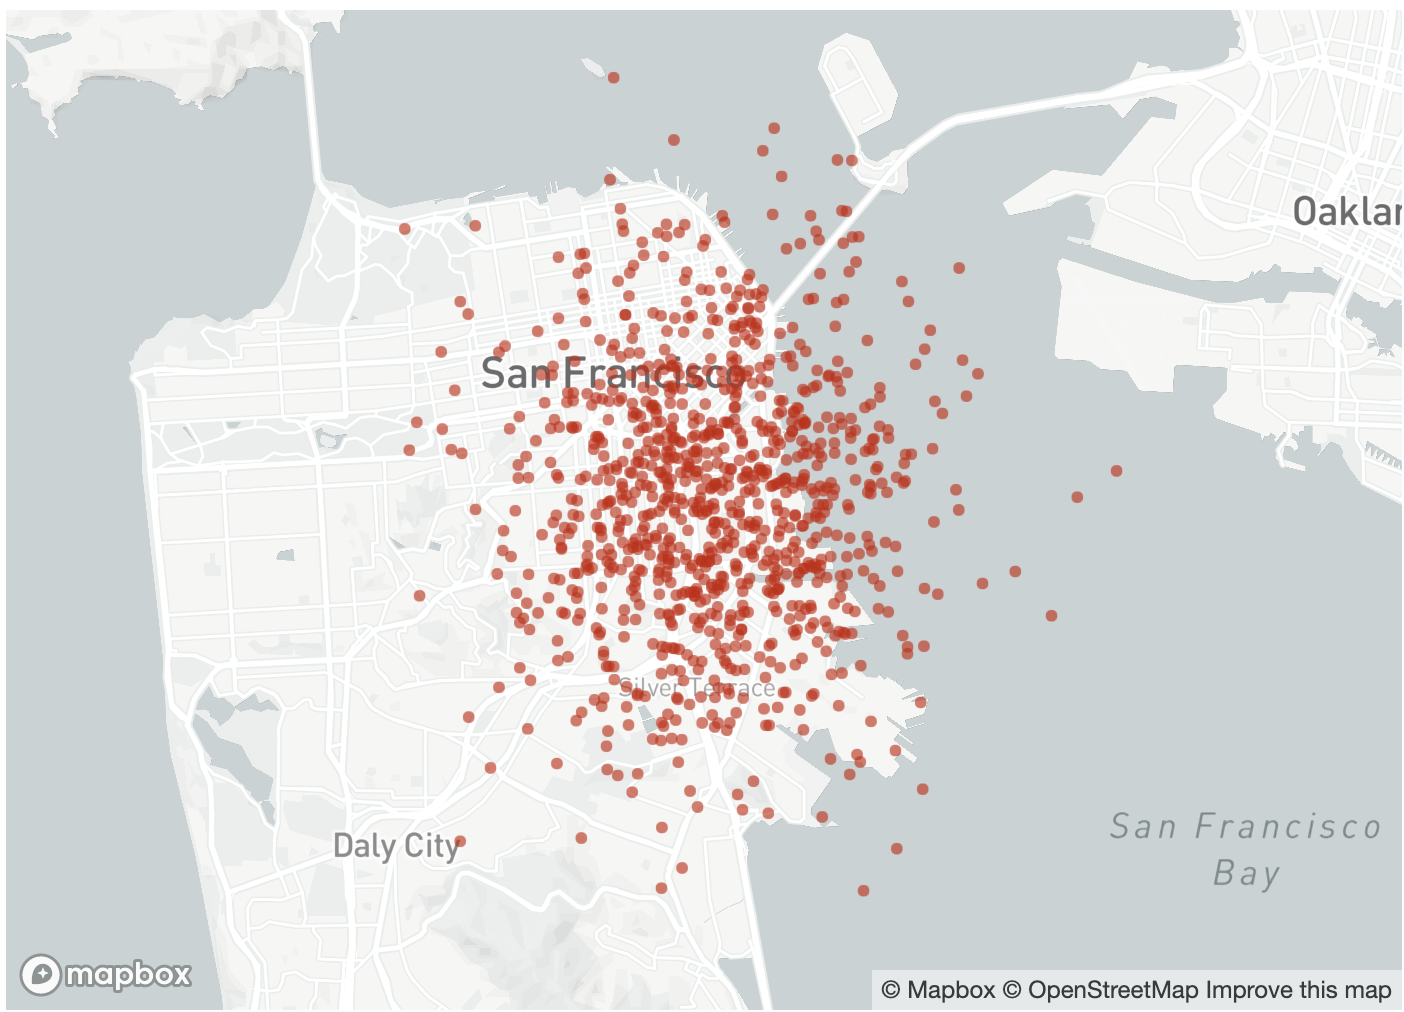
Add interactivity with widgets
streamlit은 체크박스, 버튼, 슬라이더 등 여러 interactive 위젯 API를 제공합니다. streamlit에서 제공하는 모든 API는 여기에서 확인할 수 있습니다.
- Checkbox show/hide data
st.checkbox()를 이용하면 체크박스를 이용해서 데이터 show/hide 설정을 할 수 있습니다. st.checkbox()는 위젯명을 argument로 받아서 처리합니다.
if st.checkbox('Show dataframe'):
    chart_data = pd.DataFrame(
       np.random.randn(20, 3),
       columns=['a', 'b', 'c'])

    chart_data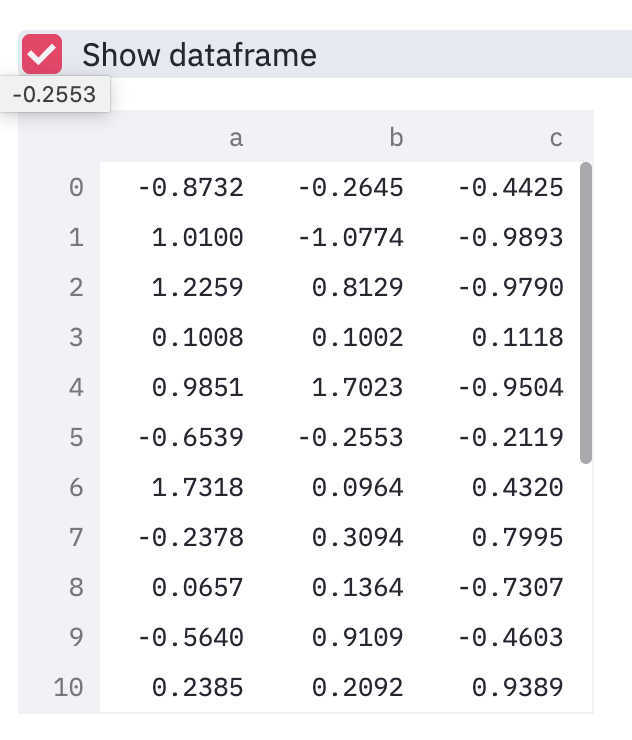
- Selectbox for options
st.selectbox()는 pandas.Series를 입력으로 받아서 옵션을 선택받게 할 수 있습니다.
import streamlit as st
import pandas as pd

st.title('TUNiBerse')
option = st.selectbox(
    '당신의 직책을 선택해주세요.',
     pd.Series(['CEO', 'AI Engineer', 'Intern', 'Product Manager']))

'You selected: ', option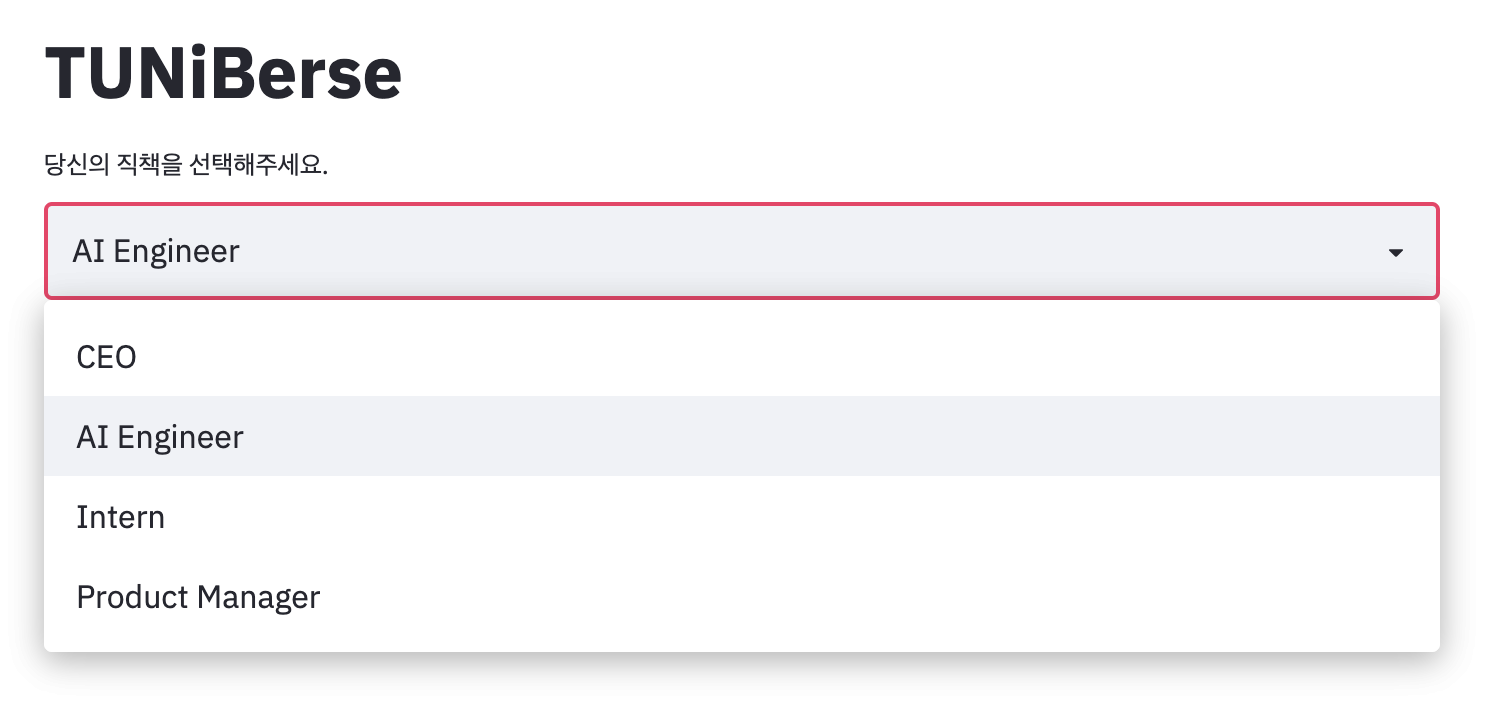
Lay out your app
웹 어플리케이션을 구현할 때 중요한 점 중 하나를 레이아웃입니다. 어떻게 화면을 구성하냐에 따라서 더 깔끔하고 직관적이게 보일 수가 있습니다. streamlit은 이런 기능 또한 손쉽게 다룰 수 있습니다.
- Selectbox를 사이드로
방금 앞에서 했던 selectbox를 사이드로 옮기고 싶다면 어떻게 해야할까요? streamlit에서는 아래와 같이 간단하게 구현 가능합니다.
import streamlit as st
import pandas as pd

st.title('TUNiBerse')
option = st.sidebar.selectbox(
    '당신의 직책을 선택해주세요.',
     pd.Series(['CEO', 'AI Engineer', 'Intern', 'Product Manager']))

'You selected: ', option
위와 같이 streamlit에서 제공하는 대부분의 element는 st.sidebar. [element_name]() 포맷으로 사용 가능합니다. 위의 위젯 외에도 button, expander 등 여러 위젯이 있으니 다양하게 사용해보시길 바랍니다.
Show progress
이번에는 웹페이지에 진행현황을 표시해봅시다. st.progress()를 이용하면 아래처럼 쉽게 사용이 가능합니다.
import time

'Starting a long computation...'

# Add a placeholder
latest_iteration = st.empty()
bar = st.progress(0)

for i in range(100):
  # Update the progress bar with each iteration.
  latest_iteration.text(f'Iteration {i+1}')
  bar.progress(i + 1)
  time.sleep(0.1)

'...and now we\'re done!'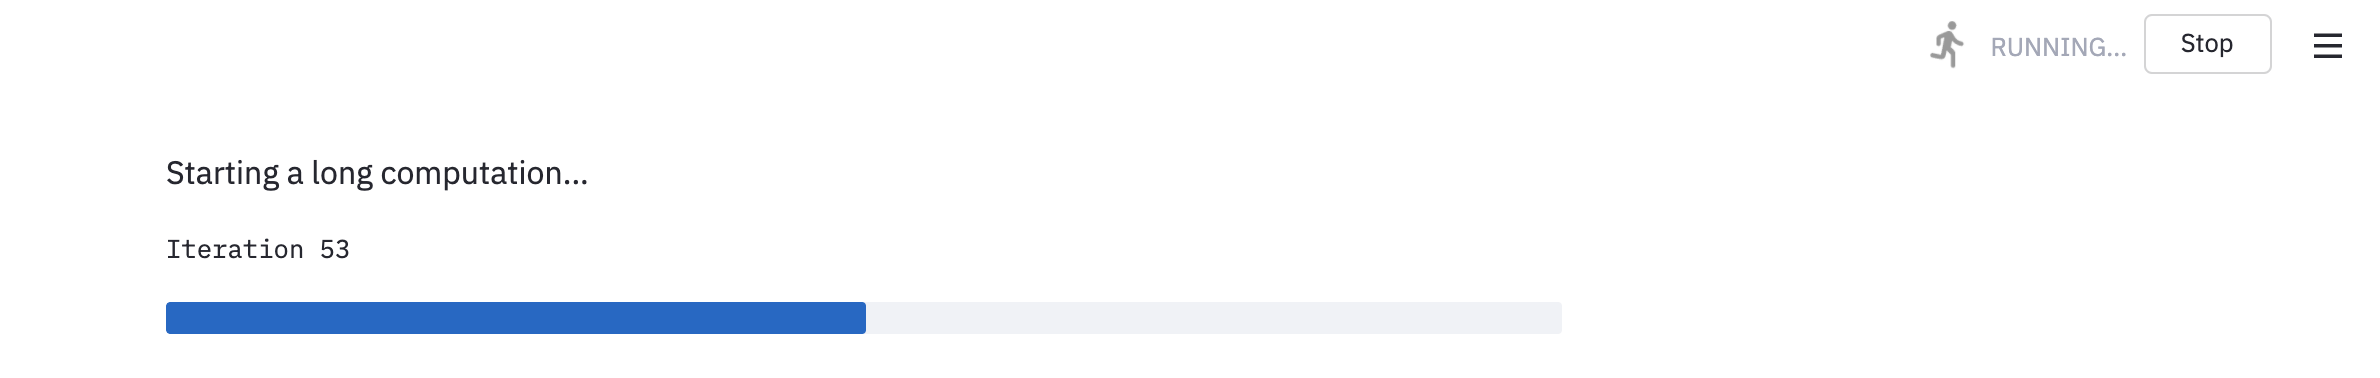
Share your app
streamlit으로 개발한 app은 Streamlit Cloud로 deploy, manage, share가 모두 가능합니다. 현재 Streamlit Cloud는 초대를 받은 멤버에 한해서 사용이 가능합니다. Request an invite에 몇 가지 사항을 제출하고 사용해주시면 됩니다.
다음 3 스텝으로 간단하게 구현 가능합니다.
- Put your app in a public Github repo (and make sure it has a requirements.txt!)
- Sign into share.streamlit.io
- Click ‘Deploy an app’ and then paste in your GitHub URL
Subscribe to SOOFTWARE
Get the latest posts delivered right to your inbox